BUSINESS INTELLIGENCE & DATA SOLUTIONS

Power BI Reporting & Dashboards That Deliver Real Business Insights

Transform complex business data into intuitive, interactive dashboards that provide real-time visibility across your organisation and support faster, more informed decision-making.

  • Gain real-time visibility into business performance
  • Replace manual reporting with automated dashboards
  • Empower teams with actionable business insights
Trusted by

Turn Data Into Actionable Business Intelligence

Most businesses already have access to valuable information. The challenge is presenting that information in a way that is easy to understand, accessible to decision-makers and capable of driving action.

Many organisations continue to rely on spreadsheets, disconnected reports and time-consuming manual processes to understand business performance. As businesses grow, these approaches become increasingly difficult to manage and often result in delayed reporting, inconsistent information and limited visibility.

Power BI provides a powerful platform for transforming raw business data into clear, interactive dashboards and reports that help organisations understand what is happening across their operations in real time.

At Sixbound, we design and develop Power BI reporting environments that help businesses gain greater visibility, improve reporting accuracy and make better decisions based on trusted information.

Whether you’re looking to create executive dashboards, automate management reporting or connect multiple systems into a single reporting platform, we help you unlock the full value of your business data.

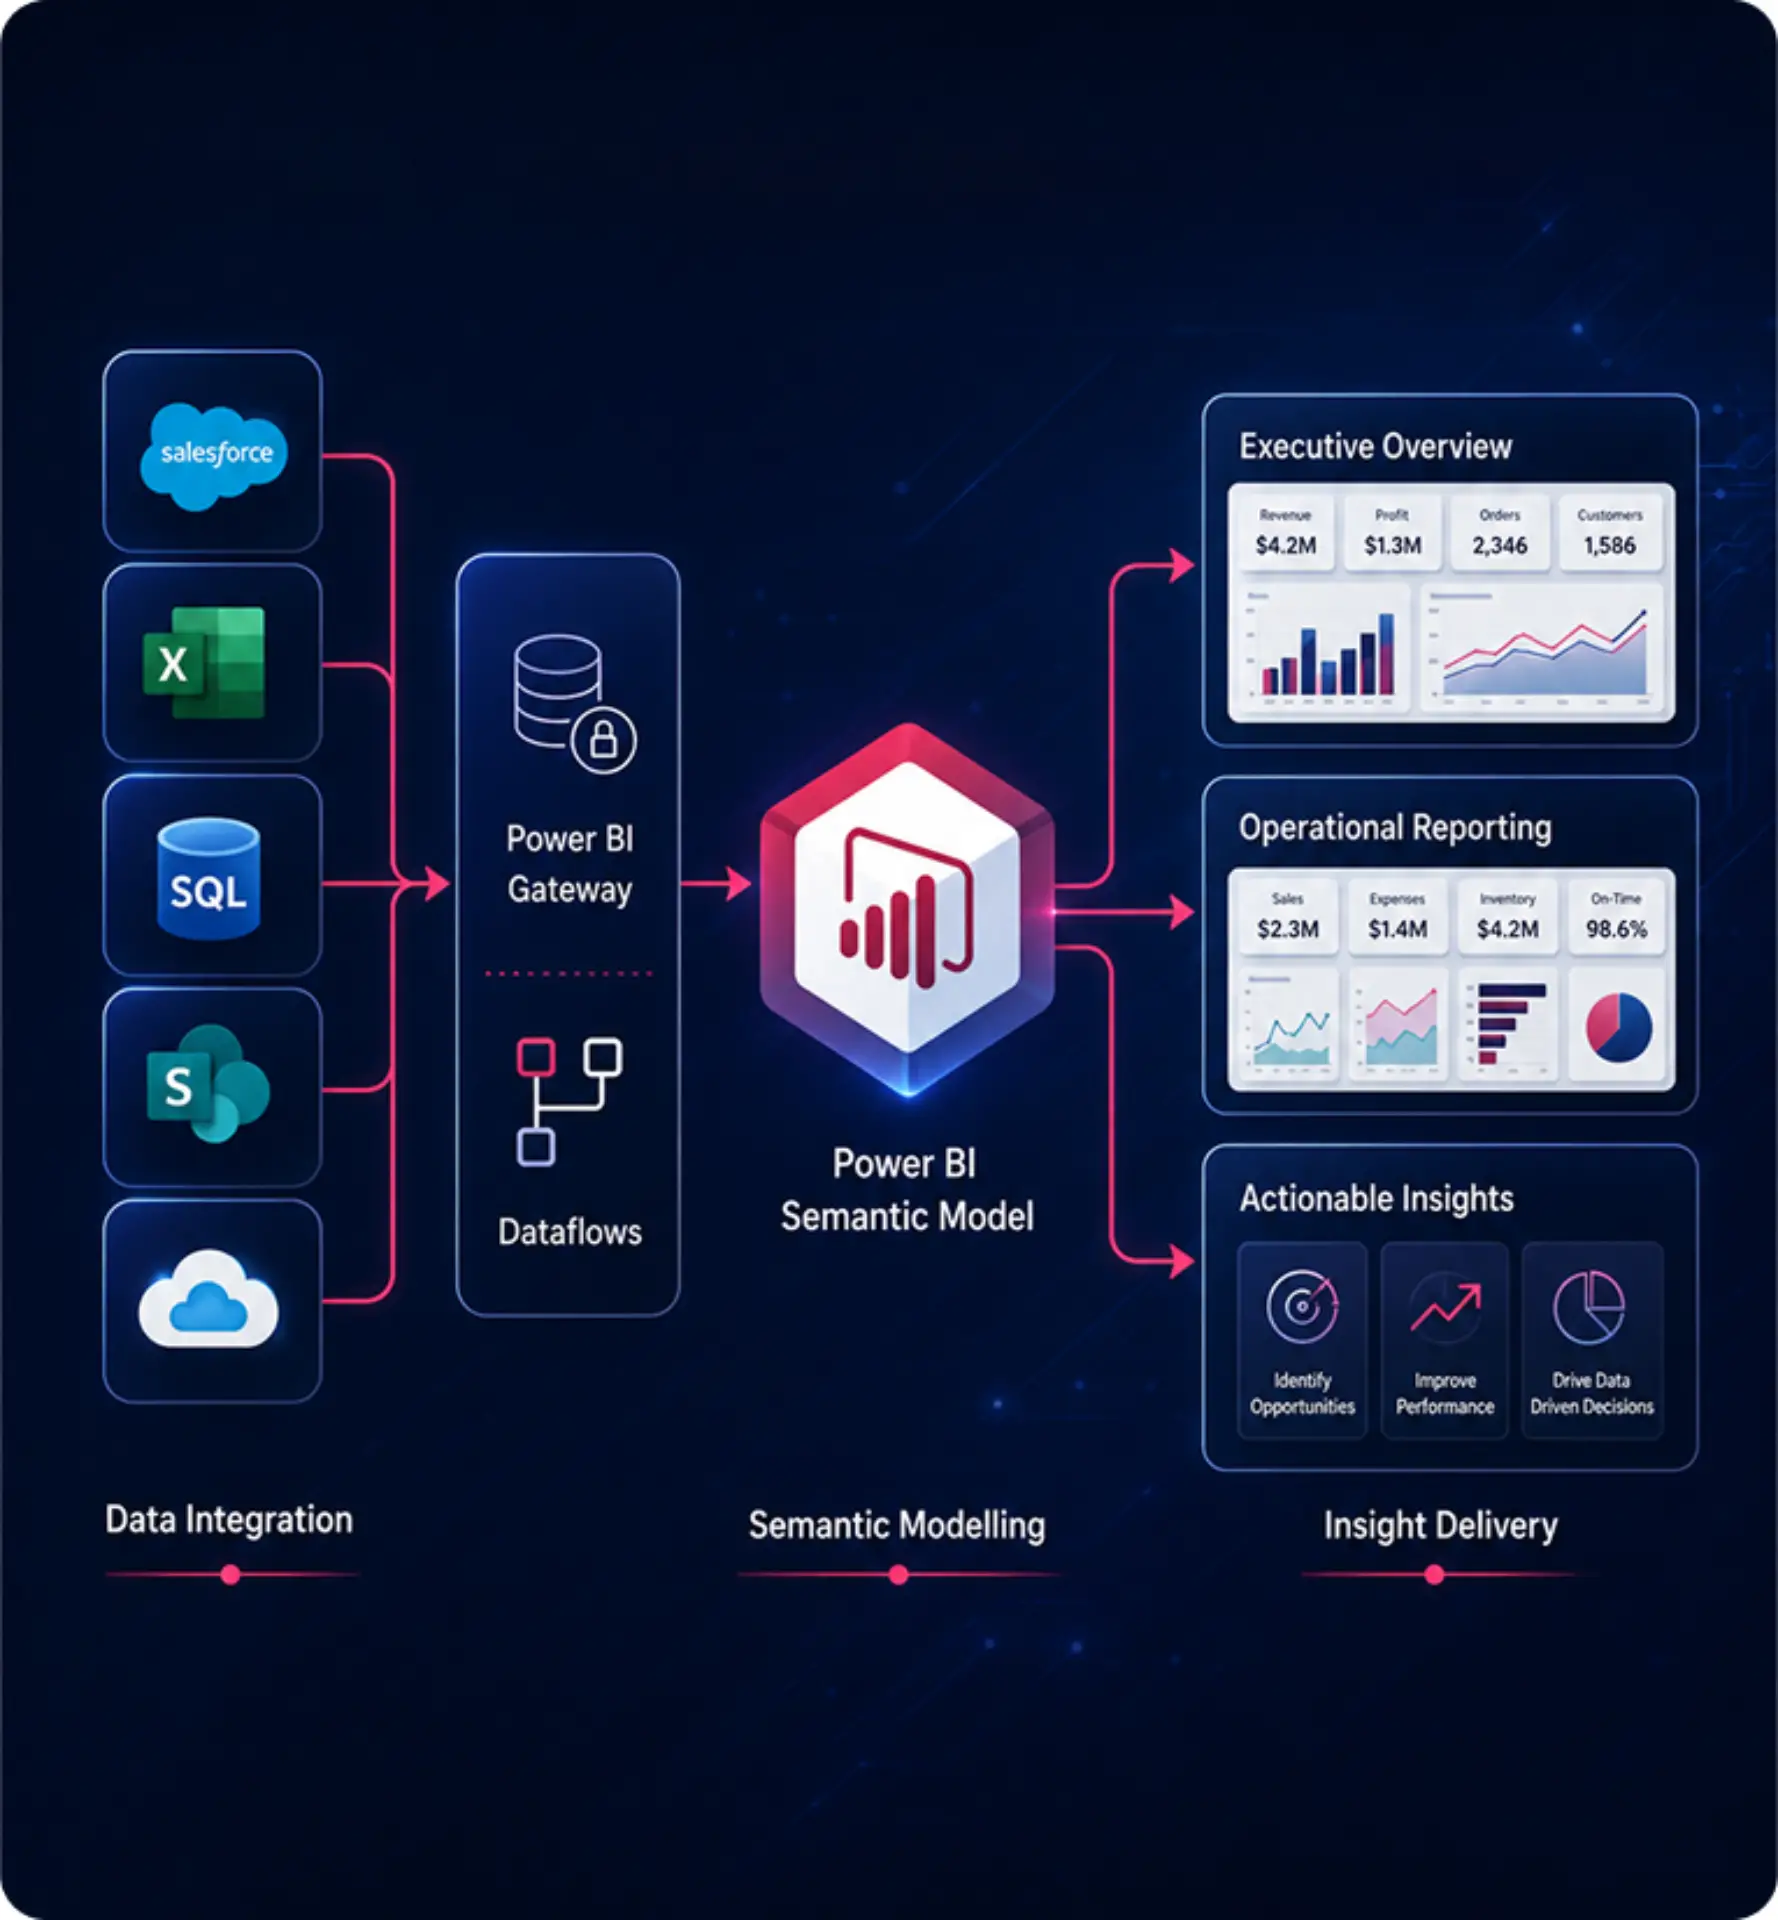
Actionable business intelligence with Power BI data analytics

The Semantic Model

The intelligence layer that turns data into trusted business insights

Power BI Ecosystem

From Data Source to Actionable Insights

Data Sources
Salesforce CRM & Operational Data
Excel / CSV Spreadsheets
SQL Server Operational Databases
Snowflake Data Warehouse
Dynamics 365 Business Applications
APIs & Web Services External Data
Files & SharePoint Documents & Reports
Data Integration
Power Query
Data Transformation
Microsoft Fabric
Data Engineering
Data Lake / SQL
Storage Layer
Power BI Semantic Model
Dimensions
📅 Date
👤 Customer
🏢 Property
📦 Asset
🌐 Region
🏷️ Product
👷 Engineer
...
Fact Tables
Fact Sales
Fact Revenue
Fact Costs
Fact Utilisation
Fact Projects
...
Measures
Total Revenue
Gross Margin
Operating Cost
Utilisation %
Pipeline Value
YoY Growth
MTD / YTD
...
Business Logic Layer
Relationships
ƒx DAX Measures
KPIs
Row Level Security
Power BI Outputs
Executive Reporting High-level performance overview
Operational Reporting Detailed operational analysis
Mobile Reporting Access insights anywhere
Alerts & Notifications Proactive insights & updates
Self-Service Analytics Empower teams with data

The Foundation Behind Every Insight

The semantic model is the core of a modern Power BI environment. It sits between your business data and the reports, applying consistent business rules, calculations, relationships and KPI definitions across the organisation.

Rather than different departments working from separate spreadsheets and conflicting figures, the semantic model creates a single source of truth that everyone can trust. Revenue, margin, utilisation, forecasting and other key metrics are defined once and reused consistently across reporting, analytics and decision-making.

Its value extends far beyond reporting. A well-designed semantic model provides the foundation for self-service analytics, AI-powered insights, natural language querying, planning, forecasting, alerts and automated business processes.

By centralising business logic and data definitions, organisations can improve reporting accuracy, reduce duplication, accelerate development and ensure every insight is built on the same trusted foundation.

Why It Matters

Single Source of Truth

Consistent, trusted data across the organisation

Consistent KPI Definitions

One set of metrics used everywhere

Faster Report Development

Reusable logic speeds up delivery

Greater Trust & Adoption

Users trust the data and use it confidently

Al Ready by Design

Use governed Power BI data to power trusted AI analysis, intelligent agents and automated workflows.

Scalable & Future-Proof

Built to grow with your business needs

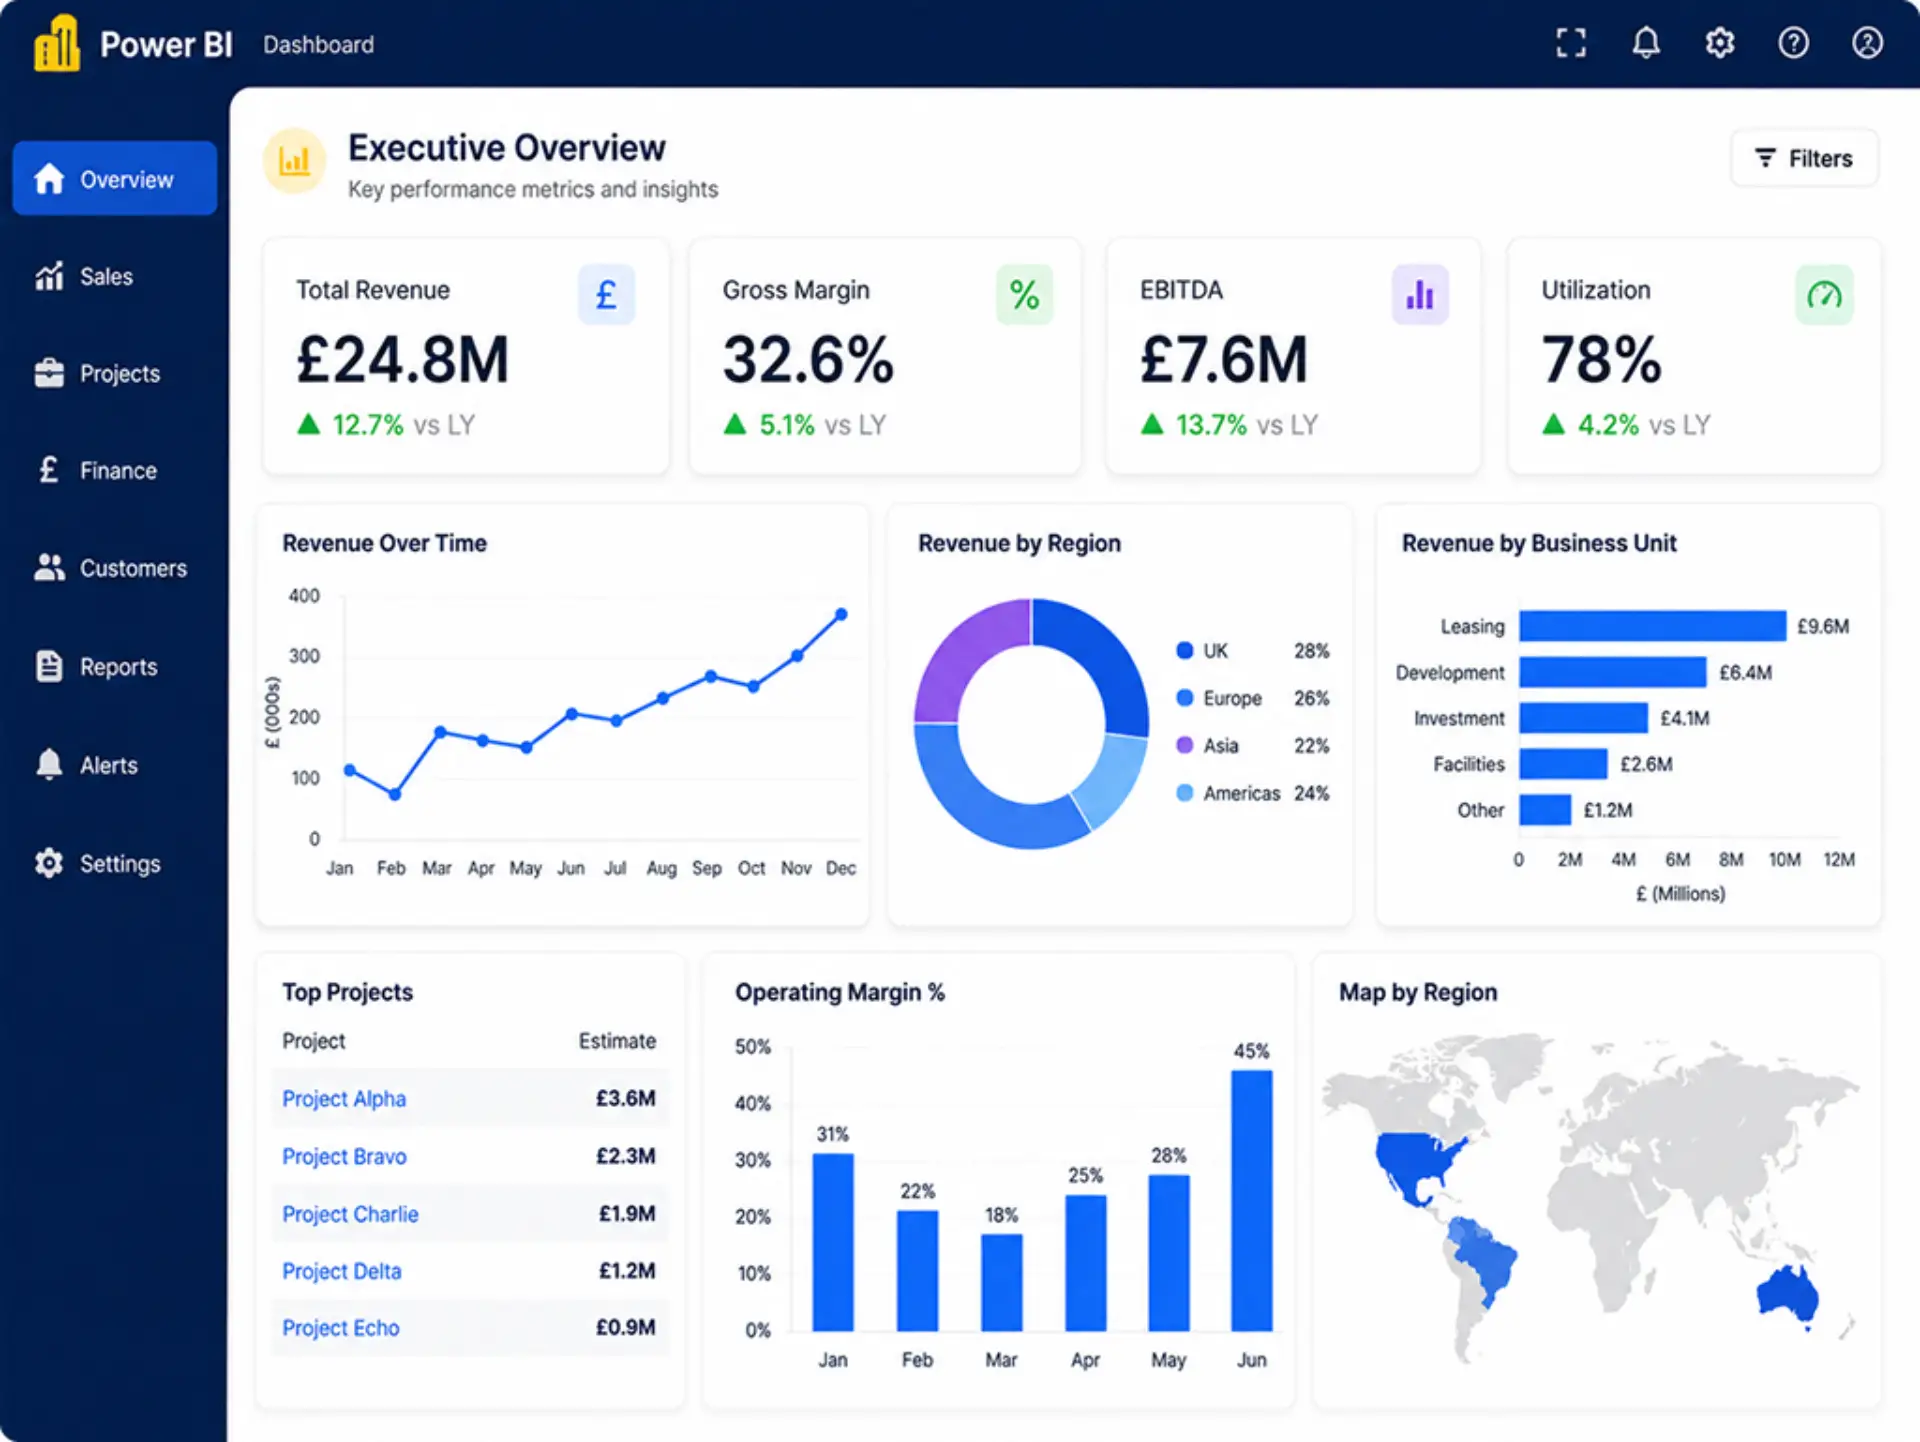
Power BI Report

Experience how modern reporting brings your data to life. Interact with this live report to explore real insights, filtered views and dynamic analysis.

  • Interactive and real-time
  • Connected to live data
  • Bulit on a governed semantic model
  • Designed for better decisions

Power BI Report

Experience how modern reporting brings your data to life. Interact with this live report to explore real insights, filtered views and dynamic analysis.

  • Interactive and real-time
  • Connected to live data
  • Bulit on a governed semantic model
  • Designed for better decisions
Interactive sample Power BI report dashboard

Power BI Solutions Designed Around Your Business

Every organisation has unique reporting requirements, operational priorities and performance metrics. Our approach focuses on creating reporting environments that support your specific business objectives.

Executive Dashboards

Provide senior leadership teams with a high-level view of business performance through intuitive dashboards that focus on the metrics that matter most. Whether monitoring financial performance, operational efficiency or business growth, executive dashboards provide immediate access to critical information.

Sales & Performance Reporting

Monitor sales activity, pipeline performance, conversion rates and customer engagement through real-time reporting dashboards. These insights help businesses identify opportunities, improve forecasting and support revenue growth.

Operational Reporting

Support day-to-day decision-making with reporting environments that provide visibility into operational performance, utilisation, productivity and workflow management. Operational dashboards help teams identify issues, monitor trends and improve efficiency across the organisation.

Multi-System Reporting

Power BI allows organisations to combine data from multiple systems into a single reporting environment. By bringing information together, businesses gain a more complete understanding of performance across departments and functions.

Financial Reporting

Create accurate, automated financial reporting environments that provide visibility into revenue, profitability, budgets, forecasting and financial performance. By automating financial reporting processes, organisations can reduce manual effort while improving confidence in reporting accuracy.


The Benefits Of Power BI Reporting

Gain Greater Visibility Across Your Organisation

Power BI dashboards provide a clear view of business performance by bringing information together into a single reporting environment. Instead of relying on multiple reports and spreadsheets, decision-makers gain access to a complete picture of performance through one trusted source of information.

Make Faster, More Informed Decisions

Access to accurate, real-time information enables organisations to respond quickly to opportunities, challenges and changing business conditions. Rather than waiting for reports to be prepared, stakeholders can access insights whenever they need them.

Improve Reporting Accuracy

By automating data collection and reporting processes, organisations reduce the risk of manual errors and improve confidence in business reporting. Accurate information leads to better decisions and improved operational performance.

Save Time Through Automation

Power BI eliminates many of the repetitive tasks associated with traditional reporting. Reports update automatically, reducing administrative effort and allowing teams to focus on analysing information rather than preparing it.

Support Business Growth

As organisations grow, reporting requirements become more complex. Power BI provides a scalable platform capable of supporting increasing volumes of data, additional users and more advanced reporting requirements.

Our Approach

Discovery

We begin by understanding your business, reporting requirements and operational objectives.

Data Review

We assess existing systems, reporting processes and available data sources.

Dashboard Design

We design reporting environments focused on usability, clarity and business value.

Development

We build and configure dashboards, reports and integrations.

Optimisation

We continually refine reporting environments to ensure they continue delivering value as business requirements evolve.

Why Businesses Choose Sixbound

At Sixbound, we understand that reporting is not about dashboards. It is about helping organisations make better decisions.

Our approach combines technical expertise with practical business understanding to ensure reporting environments deliver meaningful business value.

Rather than creating reports filled with unnecessary complexity, we focus on delivering clear, actionable insights that support growth, efficiency and performance.

Every solution is tailored to the specific needs of the organisation, ensuring reporting environments align with business objectives and operational requirements.

Why businesses choose Sixbound for Power BI reporting and business intelligence solutions

Improving Reporting Visibility For A Growing Organisation

A growing organisation was relying on multiple spreadsheets to manage operational and management reporting.
The reporting process was time-consuming, information was difficult to access and leadership teams lacked visibility into key performance indicators.
Sixbound implemented a Power BI reporting environment that connected multiple business systems and provided real-time access to performance data.

Reduced reporting preparation time by over 80%

Improved reporting accuracy across departments

Created a single source of truth for business performance

Enabled faster management decision-making

Frequently Asked Questions

Power BI provides a flexible, scalable platform for creating interactive dashboards, automating reporting and gaining greater visibility across business operations.
Yes. Power BI can connect to a wide range of systems including ERP platforms, CRM systems, SQL databases, cloud applications, APIs and spreadsheets.
No. We design reporting environments that are intuitive and accessible to both technical and non-technical users.
Yes. Power BI dashboards can be accessed securely across desktop, tablet and mobile devices.
Absolutely. We frequently work with organisations to optimise and enhance existing Power BI reporting environments.

Turn Data Into Action

Ready To Unlock The Full Value Of Your Business Data?

Discover how Power BI reporting and dashboard solutions can help your organisation gain visibility, improve reporting accuracy and make better business decisions.

Request a Consultation